Well, here we are. I’ve been working on IT monitoring for about 20 years now, and I’ve been thinking about starting a blog for quite a few of those. Over the years I built a decent amount of experience – and in my opinion, Oscar Wilde was wrong. Experience is much more than just the name we give to our mistakes. At least for this blog, I figured I’d include not just the challenges, problems and mistakes – you’ll probably be more interested in what I did to get out of them. Hopefully it will help you get things done as well.
I’m not sure on how regularly I’ll be posting; you’ll just have to monitor this blog for updates… (yes, pun fully intended).
And in case you’re wondering: yes, it’s still work in progress. As you may have noticed, I went for a pretty old theme – one that has a sidebar, but does not have a zillion options to configure. The choice was basically made for lack of time to find a better option. With the amount of themes that’s available, it has become impossible to see the forest for the trees (and by the way, that English saying actually translates to Dutch word for word with the same meaning: “door de bomen het bos niet meer zien”.
So if you have any suggestions, please let me know! And that goes for the layout just as well as for the content. The purpose of this blog is to share experiences – and that goes to pieces if my message doesn’t come across.
And one final note: I try my best to provide accurate and useful information, but I’m by no means perfect, nor do I have the resourcs to thoroughly test and research every eventuality. Therefore, feel free to use any information – but keep in mind that you do so at your own risk. I cannot be held responsible or liable for any issues that may arise out of your use of anything you find in this blog.
… the MonitoringStuff.com Windows Run As Account Management MP!
As explained during my presentation, it’s quite simple to use – and it’s FREE. I’ve taken so much from the community over the years… so I think it’s only fair I give something back.
Select a Windows server, and make sure that the following prerequisites are in place:
Disable UAC
Make sure the OperationsManager Powershell Module is installed
Make sure the ActiveDirectory Powershell Module is installed
Override the Management Agent discovery for the server
For the monitors ad task: read the Product Knowledge
Ate a later date, I will pull the relevant slides from my presentation but I didn’t want to make the SCOMathon attendees that saw my presentation, wait any longer.
Just to be sure, I do want to repeat my statement on liability: I cannot accept any, ever. Use at your own risk and enjoy!
Sometimes, simple things can take many hours to solve. While working on a custom MP that contains a Powershell script, I kept getting event 22406 (Powershell script error), stating "System.Management.Automation.ParseException: Missing closing '}' in statement block or type definition."
Now, the error in itself seems quite obvious – and the search for the opening curly brace began. It’s not exactly my first rodeo when it comes to debugging semi-colons, single and double quotes, brackets and braces – syntax highlighting saved my bacon plenty of times. And although VSAE ( my MP building tool of choice) isn’t very good at Powershell syntax highlighting, it’s easy to open the script in Powershell ISE.
But even there, I found nothing wrong – the curly braces all neatly matched up. Then I ran the script on the targeted server, and… it worked fine. 🤨
To make sure I didn’t have any hidden characters, I copied the script content to Notepad, deleted it in VSAE and copy/pasted it back from Notepad. Hit F5 to build and deploy to my test SCOM environment… no errors. 🙂
Checked the event log… and *poof*. The 22406es were back. 😠
I then replaced the script contents with only a few lines (those of you that use Kevins MP fragments will recognize them):
$ScriptName = "MyMPScript.ps1"
$EventID = "1234"
#=================================================================================


# Starting Script section - All scripts get this
#=================================================================================
# Gather the start time of the script
$StartTime = Get-Date
#Set variable to be used in logging events
$whoami = whoami
# Load MOMScript API
$momapi = New-Object -comObject MOM.ScriptAPI
#Log script event that we are starting task
$momapi.LogScriptEvent($ScriptName,$EventID,0,"`n Script is starting. `n Running as ($whoami). `n Management Group: ($MGName).")
#=================================================================================
Now, I dare you to find any curly brace in there… yep. There aren’t any. Hit F5 to build and deploy to my test SCOM environment… no errors. 🙂
Checked the event log… and *poof*. The 22406es were back… "System.Management.Automation.ParseException: Missing closing '}' in statement block or type definition." 😶
So I opened the file again… removed al the contents and saved it. I checked the folder, expecting to find the file with 0 bytes length. However, the folder view kept showing 1kb (which is the minimum an Explorer window will show). Checked the properties… 3 bytes.
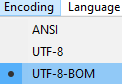
That’s when it dawned on me. I opened the file in Notepad++ and yep… for some reason, the file had become encoded as UTF-8-BOM.
Switched the file to UTF-8, repasted the content… saved… hit F5 to build and deploy to my test SCOM environment… no errors. So far, so good. Checked the event log… and saw event 1234 popping up with the exact message I expected.
I then put the original script contents (which I had copied out to Notepad) back in, did the F5 and eventlog check again… and all was well. I got the event I expected and and at almost the same time, I saw the entities in the SCOM console turn from “Not monitored” to “Healthy”.
Considering the time this took me, I figured I’d share my experience – and some of my frustrations 🙃
Sometimes, even proper change hygiene can’t prevent issues. If that surprises you, you haven’t been in IT long enough… and recently, we again saw proof of this.
We use Hyper-V as our virtualization platform, managed by SCVMM and monitored by SCOM, using the SCVMM Management Pack. So far, nothing really weird (although I know several VMWare fanatics who would disagree, but let’s skip that part…)
As part of the usual lifecycle management principles, the team responsible for the virtualization and storage decided to replace our classic storage environment by a more software-defined approach involving the new Storage Spaces Direct (S2D) functionality in Windows Server 2016. And that is managed through SCVMM.
Now, SCOM is not a very fast application – and in part, that’s because the SQL side of it is not the most efficient application out there. Basically,if we do not see a deadlock a few times a day, we’re worrying that something is wrong… and if the slowness gets worse, we usually look at the SQL side first.
And that is also what we did when we started getting complaints that SCOM wasn’t just slow, it was completely freezing. Checking the SQL side we saw plenty of indications of resource hogs. Now, I don’t pretend to be a SQL specialist… I just know some very good resources, like Paul Randal’s fantastic blog on Wait Stats and of course, the massive amount of information from Brent Ozar.
We also filed a support case with Microsoft, and after quite some – very well executed – investigations we concluded that both the resources and the configuration of the SCOM database servers should be OK for the workloads. I did get some good suggestions for fine-tuning, but we were sure there were no dramatic underlying issues with AlwaysOn, disk I/O and the likes.
Looking at all the information I had gathered, I couldn’t stop thinking that it must be a previously undiscovered entity – and a big one. And by big, I mean that you’d have a diagram view with thousands of objects. At first, I thought it was our new VDI implementation – if you think of a cluster with several nodes and a few thousand VDI’s, that would classify as a big entity. Fortunately, there’s a good way to disable discovery of the resource groups – check out this blog post. We had that override in place for Server 2012R2, but not yet for Server 2016.
We applied the override, and thought we fixed the problem. But when we checked the next morning, we apparently hadn’t even come close – SCOM was still pretty much frozen. So our journey went on… Using sp_who2 I created a temp table, checking for the head blocker. I then set a SQL Profiler trace on that process, and there was a query that didn’t fire very often but when it did, it went to the absolute top in CPU usage. The query mentioned “DiscoverySourceID”, along with a GUID.
Ever heard of “letting sleeping dogs lie”? Well, there’s a dog in the SCVMM Management Pack. It’s a discovery, called Microsoft.SystemCenter.VirtualMachineManager.Storage.2016.Discovery.Discovery. (Yes, it actually has the word “Discovery” in it twice). And it’s not vicious, it’s downright rabid… think Cujo.
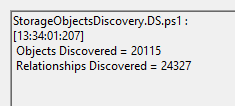
The GUID that i found in the query, led me to the discovery, and the trace showed me the Management Server that the discovery was running on. It fires a Powershell script, that logs event 108. In the OperationsManager eventlog on the Management Server, I then found this:
Whoa.
Hang on.
20.000 objects? 24000 relationships?? How many group memberships would that involve? With the recursive memberships??? Like I said, think Cujo… this was a downright horror movie for SQL Server. When that much info is dumped into the OperationsManager database, SQL Server probably simply got traumatized.
Looking through the script, it apparently discovers all storage objects in VMM. And all of their relationships. For more info, check the systemcenter.wiki page…
We disabled the discovery, and then ran Remove-SCOMDisabledClassInstance several times over the course of a few days. Pretty soon, SQL was getting happy again…
From the Microsoft Support case, this was identified as a bug and registered as such. I hope to be able to update this post soon with a fix…
Creating a SCOM Management Pack is not the hardest thing in the world, as long as you want to monitor something on a single box. There’s an excellent course by Brian Wren on Channel9, and Kevin Holman has made life a whole lot easier by publishing his famous VSAE fragments.
But what if you want to monitor larger entities, like firewall clusters or storage arrays? Preferably by using not a single point of failure? Well, SCOM has a solution for this: Resource Pools. Kevin has written a great blog post on these, detailing how to populate them and what the requirements are, if you want high availability.
Some time ago, we started getting complaints from one of our systems management teams. We have quite a large number of Web Application Availability Monitoring configurations active, and these were using the agents on two dedicated servers. One of these was experiencing problems, causing false alerts. We ended up reinstalling it, but that left us with something I despise: reconfiguring all the web monitors, manually.
That started me thinking about the Resource Pools. What if we could move the web monitors to a Resource Pool? Better yet, what if we could set up our own Resource Pool – and use that to run workflows on as we saw fit? Would that be feasible?
It took some time, but yes – that will work. It turns out that creating your own Resource Pool isn’t even that hard, and using the Powershell scripts from Kevins blog you can populate them with any Management Servers you want to use for this purpose. It’s even possible to include agents – but please keep in mind, Microsoft does not support using agents in a Resource Pool. That being said, we have this exact setup running – without any problems so far.
The XML is quite simple, if you know how to read SCOM MP’s. For obvious reasons, it contains a class for the Resource Pool:
With this XML, you should be able to create a SCOM Resource Pool to provide highly available monitoring ; the complete file is available on Github. However, you might want to wait – I’m working on a complete, sealed MP with some classes that are targeted against this Resource Pool, ready to use.